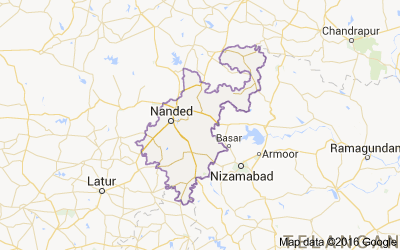
Talukas in Nanded district, Maharashtra - Census 2011

List of all Talukas in Nanded district of Maharashtra. Click on the Taluka name to get complete details villages and towns with Population, Caste, Religion, Literacy, Sex Ration data.
The total population of Nanded District is 3,361,292 out of which urban population is 913,898 while rural is 2,447,394. As per Census 2011, total families in Nanded district were 171,093. Check out important data about Nanded district as per Census 2011.
Nanded District data as per Census 2011
| Total | Rural | Urban | |
|---|---|---|---|
| Population | 3,361,292 | 2,447,394 | 913,898 |
| Children (0-6 years) | 459,572 | 341,023 | 118,549 |
| Literacy | 75.45% | 72.6% | 83% |
| Sex Ratio | 943 | 945 | 937 |
| Scheduled Caste | 19.1% | 19.3% | 18.3% |
| Scheduled Tribe | 8.4% | 9.9% | 4.4% |
List of Talukas in Nanded district
Below is list of all Talukas in Nanded district with important data such as Population, Literacy rate and Sex Ratio.
| # | Taluka | Towns & Villages | Population | Literacy | Sex Ratio |
|---|---|---|---|---|---|
| 1 | Ardhapur | Towns & Villages | 109,332 | 64.1% | 932 |
| 2 | Bhokar | Towns & Villages | 138,313 | 63.1% | 946 |
| 3 | Biloli | Towns & Villages | 170,159 | 59% | 960 |
| 4 | Deglur | Towns & Villages | 227,862 | 63.6% | 962 |
| 5 | Dharmabad | Towns & Villages | 96,776 | 62.7% | 989 |
| 6 | Hadgaon | Towns & Villages | 259,986 | 65% | 938 |
| 7 | Himayatnagar | Towns & Villages | 109,727 | 61.7% | 948 |
| 8 | Kandhar | Towns & Villages | 248,870 | 63.5% | 930 |
| 9 | Kinwat | Towns & Villages | 247,786 | 64.3% | 965 |
| 10 | Loha | Towns & Villages | 241,885 | 62.7% | 939 |
| 11 | Mahoor | Towns & Villages | 99,940 | 66.4% | 942 |
| 12 | Mudkhed | Towns & Villages | 115,696 | 63% | 932 |
| 13 | Mukhed | Towns & Villages | 293,885 | 62.8% | 936 |
| 14 | Naigaon (Khairgaon) | Towns & Villages | 182,868 | 63% | 947 |
| 15 | Nanded | Towns & Villages | 719,188 | 72.5% | 928 |
| 16 | Umri | Towns & Villages | 99,019 | 60.7% | 960 |