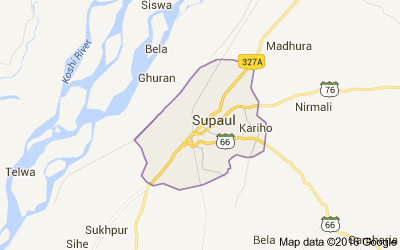
Blocks in Supaul district, Bihar - Census 2011

List of all Blocks in Supaul district of Bihar. Click on the Block name to get complete details villages and towns with Population, Caste, Religion, Literacy, Sex Ration data.
The total population of Supaul District is 2,229,076 out of which urban population is 105,558 while rural is 2,123,518. As per Census 2011, total families in Supaul district were 20,493. Check out important data about Supaul district as per Census 2011.
Supaul District data as per Census 2011
| Total | Rural | Urban | |
|---|---|---|---|
| Population | 2,229,076 | 2,123,518 | 105,558 |
| Children (0-6 years) | 437,357 | 419,703 | 17,654 |
| Literacy | 57.67% | 56.89% | 72.74% |
| Sex Ratio | 929 | 931 | 892 |
| Scheduled Caste | 15.9% | 16.2% | 10.2% |
| Scheduled Tribe | 0.5% | 0.5% | 0.1% |
List of Blocks in Supaul district
Below is list of all Blocks in Supaul district with important data such as Population, Literacy rate and Sex Ratio.
| # | Block | Towns & Villages | Population | Literacy | Sex Ratio |
|---|---|---|---|---|---|
| 1 | Basantpur | Towns & Villages | 202,007 | 47.1% | 924 |
| 2 | Chhatapur | Towns & Villages | 286,456 | 46.1% | 927 |
| 3 | Kishanpur | Towns & Villages | 167,669 | 44.8% | 934 |
| 4 | Marauna | Towns & Villages | 145,136 | 43.2% | 943 |
| 5 | Nirmali | Towns & Villages | 98,435 | 46.7% | 937 |
| 6 | Pipra | Towns & Villages | 201,399 | 43.9% | 932 |
| 7 | Pratapganj | Towns & Villages | 106,884 | 46.1% | 927 |
| 8 | Raghopur | Towns & Villages | 215,643 | 46.6% | 940 |
| 9 | Saraigarh Bhaptiyahi | Towns & Villages | 122,772 | 46.9% | 941 |
| 10 | Supaul | Towns & Villages | 360,198 | 48.5% | 918 |
| 11 | Tribeniganj | Towns & Villages | 322,477 | 47.1% | 926 |