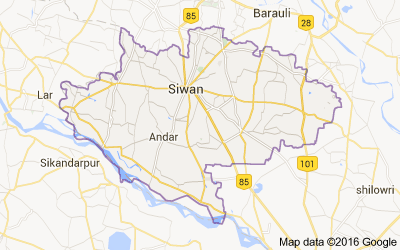
Blocks in Siwan district, Bihar - Census 2011

List of all Blocks in Siwan district of Bihar. Click on the Block name to get complete details villages and towns with Population, Caste, Religion, Literacy, Sex Ration data.
The total population of Siwan District is 3,330,464 out of which urban population is 182,913 while rural is 3,147,551. As per Census 2011, total families in Siwan district were 28,606. Check out important data about Siwan district as per Census 2011.
Siwan District data as per Census 2011
| Total | Rural | Urban | |
|---|---|---|---|
| Population | 3,330,464 | 3,147,551 | 182,913 |
| Children (0-6 years) | 551,418 | 525,960 | 25,458 |
| Literacy | 69.45% | 68.95% | 77.93% |
| Sex Ratio | 988 | 993 | 917 |
| Scheduled Caste | 11.6% | 11.9% | 6.2% |
| Scheduled Tribe | 2.6% | 2.7% | 1.8% |
List of Blocks in Siwan district
Below is list of all Blocks in Siwan district with important data such as Population, Literacy rate and Sex Ratio.
| # | Block | Towns & Villages | Population | Literacy | Sex Ratio |
|---|---|---|---|---|---|
| 1 | Andar | Towns & Villages | 110,027 | 58.1% | 1,020 |
| 2 | Barharia | Towns & Villages | 321,292 | 57% | 957 |
| 3 | Basantpur | Towns & Villages | 105,229 | 55.9% | 958 |
| 4 | Bhagwanpur Hat | Towns & Villages | 220,651 | 58.7% | 978 |
| 5 | Darauli | Towns & Villages | 174,357 | 58.3% | 990 |
| 6 | Daraundha | Towns & Villages | 173,200 | 57.3% | 1,021 |
| 7 | Goriakothi | Towns & Villages | 223,709 | 55.8% | 1,012 |
| 8 | Guthani | Towns & Villages | 128,155 | 59.8% | 994 |
| 9 | Hasanpura | Towns & Villages | 149,580 | 56.6% | 1,047 |
| 10 | Hussainganj | Towns & Villages | 182,794 | 57.2% | 965 |
| 11 | Lakri Nabiganj | Towns & Villages | 128,899 | 53% | 1,024 |
| 12 | Maharajganj | Towns & Villages | 190,217 | 56.9% | 1,019 |
| 13 | Mairwa | Towns & Villages | 113,499 | 60.2% | 959 |
| 14 | Nautan | Towns & Villages | 90,714 | 57.4% | 978 |
| 15 | Pachrukhi | Towns & Villages | 201,759 | 57.7% | 984 |
| 16 | Raghunathpur | Towns & Villages | 157,694 | 57.3% | 1,022 |
| 17 | Siswan | Towns & Villages | 153,953 | 57.3% | 982 |
| 18 | Siwan | Towns & Villages | 340,983 | 62.9% | 940 |
| 19 | Ziradei | Towns & Villages | 163,752 | 59.2% | 1,010 |