Sivaganga District Population, Caste, Religion Data (Tamil Nadu) - Census 2011
Sivaganga district of Tamil Nadu has a total population of 1,339,101 as per the Census 2011. Out of which 668,672 are males while 670,429 are females. In 2011 there were a total 338,938 families residing in Sivaganga district. The Average Sex Ratio of Sivaganga district is 1,003.
As per Census 2011 out of total population, 30.8% people live in Urban areas while 69.2% live in the Rural areas. The average literacy rate in urban areas is 89.1% while that in rural areas is 75.7%. Also the Sex Ratio of Urban areas in Sivaganga district is 1,000 while that of Rural areas is 1,004.
The population of Children of age 0-6 years in Sivaganga district is 137235 which is 10% of the total population. There are 70022 male children and 67213 female children between the age 0-6 years. Thus as per the Census 2011 the Child Sex Ratio of Sivaganga is 960 which is less than Average Sex Ratio (1,003) of Sivaganga district.
The total literacy rate of Sivaganga district is 79.85%. The male literacy rate is 78.71% and the female literacy rate is 64.65% in Sivaganga district.
To facilitate the administration, Sivaganga district is further divided into 6 Talukas (Taluka/Tehsil/Tahsil) which are administrative divisions denoting sub-districts. Talukas consists of multiple villages and a few towns.
Sivaganga Data as per Census 2011
As per the Population Census 2011 data, following are some quick facts about Sivaganga district.
| Total | Male | Female | |
|---|---|---|---|
| Children (Age 0-6) | 137,235 | 70,022 | 67,213 |
| Literacy | 79.85% | 78.71% | 64.65% |
| Scheduled Caste | 227,746 | 113,599 | 114,147 |
| Scheduled Tribe | 790 | 394 | 396 |
| Illiterate | 379,357 | 142,368 | 236,989 |
Caste-wise Population - Sivaganga district
Schedule Caste (SC) constitutes 17% while Schedule Tribe (ST) were 0.1% of total population in Sivaganga district of Tamil Nadu.
| Total | Male | Female | |
|---|---|---|---|
| Schedule Caste | 227,746 | 113,599 | 114,147 |
| Schedule Tribe | 790 | 394 | 396 |
Religion-wise Population - Sivaganga district
| Religion | Total | Male | Female | |
|---|---|---|---|---|
| Hindu | 1,186,078 | (88.57%) | 592,770 | 593,308 |
| Muslim | 74,310 | (5.55%) | 37,200 | 37,110 |
| Christian | 75,481 | (5.64%) | 37,160 | 38,321 |
| Sikh | 150 | (0.01%) | 78 | 72 |
| Buddhist | 80 | (0.01%) | 36 | 44 |
| Jain | 109 | (0.01%) | 52 | 57 |
| Other Religion | 24 | (0%) | 13 | 11 |
| No Religion Specified | 2,869 | (0.21%) | 1,363 | 1,506 |
Literacy Rate - Sivaganga district
The total literacy rate of Sivaganga district was 79.85% in 2011 which is less than average literacy rate 80.09% of Tamil Nadu. Population-wise, out of total 959,744 literates, males were 526,304 while females were 433,440. Also the male literacy rate was 87.92% and the female literacy rate was 71.85% in Sivaganga district.
| Sivaganga district | Tamil Nadu | |
|---|---|---|
| Female | 71.85% | 73.44% |
| Male | 87.92% | 86.77% |
| Total | 79.85% | 80.09% |
Sex Ratio - Sivaganga district
The Sex Ratio of Sivaganga district is 1,003 . Thus for every 1000 men there were 1,003 females in Sivaganga district. Also as per Census 2011, the Child Sex Ration was 960 which is less than Average Sex Ratio ( 1,003 ) of Sivaganga district.
Population Density - Sivaganga district
The total area of Sivaganga district is 4,233 km2. Thus the density of Sivaganga district is 316 people per square kilometer. As per the initial provisional data of Census 2011, around 177 sq. km. area is under urban region while 4,056 sq. km. is under rural region.
Urban/Rural Population - Sivaganga district
As per the Census 2011 out of total population of Sivaganga, 30.83% people lived in urban regions while 69.17% in rural areas. The total urban population was 412,845 out of which 206,462 were males while the remaining 206,383 were females. In rural areas of Sivaganga, male population was 462,210 while the female population was 464,046.
The average sex ratio in urban regions of Sivaganga was 1,000 females per 1000 males. Also the Child (0-6 age) sex ration of urban areas in Sivaganga was 956 girls per 1000 boys. Thus the total children (0-6 age) living in urban areas of Sivaganga were 41,672 which is 10.09% of total urban population. Similarly the average sex ratio in rural areas of Sivaganga was 1,004 females per 1000 males. The Child sex ratio of rural areas in Sivaganga was 962 girls per 1000 boys.
The average literacy rate in Sivaganga for urban regions was 89.1 percent in which males were 93.65% literate while female literacy stood at 84.56%. The total literate population of Sivaganga was 959,744. Similarly in rural areas of Sivaganga, the average literacy rate was 75.73 percent. Out of which the literacy rate of males and females stood at 85.35% and 66.19% respectively. Total literates in rural areas of Sivaganga were 629,045.
| Rural | Urban | |
|---|---|---|
| Population % | 69.17% | 30.83% |
| Total population | 926,256 | 412,845 |
| Male population | 462,210 | 206,462 |
| Female population | 464,046 | 206,383 |
| Sex ratio | 1,004 | 1,000 |
| Child sex ratio (0-6 age) | 962 | 956 |
| Child population | 95,563 | 41,672 |
| Literates | 629,045 | 330,699 |
| Average literacy | 75.73% | 89.1% |
| Male literacy | 85.35% | 93.65% |
| Female literacy | 66.19% | 84.56% |
Child Population - Sivaganga district
According to Census 2011, there were 137,235 children between age 0 to 6 years in Sivaganga district. Out of which 70,022 were male while 67,213 were female.
Working Population - Sivaganga district
In Sivaganga district out of total population, 620,171 were engaged in work activities. 74.4% of workers describe their work as Main Work (Employment or Earning more than 6 Months) while 25.6% were involved in Marginal activity providing livelihood for less than 6 months. Of 620,171 workers engaged in Main Work, 117,030 were cultivators (owner or co-owner) while 122,166 were Agricultural labourers.
| Total | Male | Female | |
|---|---|---|---|
| Main Workers | 461,102 | 312,099 | 149,003 |
| Cultivators | 117,030 | 74,854 | 42,176 |
| Agriculture Labourer | 122,166 | 65,134 | 57,032 |
| Household Industries | 9,864 | 5,507 | 4,357 |
| Other Workers | 212,042 | 166,604 | 45,438 |
| Marginal Workers | 159,069 | 79,206 | 79,863 |
| Non Working | 718,930 | 277,367 | 441,563 |
Nearby Districts from Sivaganga
Below are the list of Districts near Sivaganga district in Tamil Nadu.
| District | Population |
|---|---|
| Madurai district population | 3,038,252 |
| Pudukkottai district population | 1,618,345 |
| Thanjavur district population | 2,405,890 |
| Theni district population | 1,245,899 |
| Virudhunagar district population | 1,942,288 |
| Thiruvarur district population | 1,264,277 |
| Nagapattinam district population | 1,616,450 |
| Ramanathapuram district population | 1,353,445 |
| Cuddalore district population | 2,605,914 |
| Thoothukkudi district population | 1,750,176 |
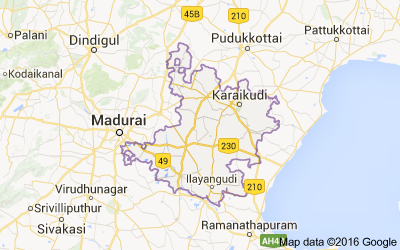
Sivaganga district Map
Reference
- Census 2011 Data - censusindia.gov.in
- Sivaganga, Tamil Nadu - Wikipedia