Bargarh District Population, Caste, Religion Data (Odisha) - Census 2011
Bargarh district of Odisha has a total population of 1,481,255 as per the Census 2011. Out of which 749,161 are males while 732,094 are females. In 2011 there were a total 370,308 families residing in Bargarh district. The Average Sex Ratio of Bargarh district is 977.
As per Census 2011 out of total population, 10.1% people live in Urban areas while 89.9% live in the Rural areas. The average literacy rate in urban areas is 85.8% while that in rural areas is 73.4%. Also the Sex Ratio of Urban areas in Bargarh district is 961 while that of Rural areas is 979.
The population of Children of age 0-6 years in Bargarh district is 162922 which is 11% of the total population. There are 83267 male children and 79655 female children between the age 0-6 years. Thus as per the Census 2011 the Child Sex Ratio of Bargarh is 957 which is less than Average Sex Ratio (977) of Bargarh district.
The total literacy rate of Bargarh district is 74.62%. The male literacy rate is 74.38% and the female literacy rate is 58.27% in Bargarh district.
To facilitate the administration, Bargarh district is further divided into 15 Blocks (Taluka/Tehsil/Tahsil) which are administrative divisions denoting sub-districts. Blocks consists of multiple villages and a few towns.
Bargarh Data as per Census 2011
As per the Population Census 2011 data, following are some quick facts about Bargarh district.
| Total | Male | Female | |
|---|---|---|---|
| Children (Age 0-6) | 162,922 | 83,267 | 79,655 |
| Literacy | 74.62% | 74.38% | 58.27% |
| Scheduled Caste | 298,780 | 150,420 | 148,360 |
| Scheduled Tribe | 281,135 | 140,542 | 140,593 |
| Illiterate | 497,472 | 191,944 | 305,528 |
Caste-wise Population - Bargarh district
Schedule Caste (SC) constitutes 20.2% while Schedule Tribe (ST) were 19% of total population in Bargarh district of Odisha.
| Total | Male | Female | |
|---|---|---|---|
| Schedule Caste | 298,780 | 150,420 | 148,360 |
| Schedule Tribe | 281,135 | 140,542 | 140,593 |
Religion-wise Population - Bargarh district
| Religion | Total | Male | Female | |
|---|---|---|---|---|
| Hindu | 1,459,065 | (98.5%) | 737,917 | 721,148 |
| Muslim | 7,527 | (0.51%) | 3,943 | 3,584 |
| Christian | 11,744 | (0.79%) | 5,824 | 5,920 |
| Sikh | 652 | (0.04%) | 346 | 306 |
| Buddhist | 161 | (0.01%) | 78 | 83 |
| Jain | 125 | (0.01%) | 65 | 60 |
| Other Religion | 44 | (0%) | 24 | 20 |
| No Religion Specified | 1,937 | (0.13%) | 964 | 973 |
Literacy Rate - Bargarh district
The total literacy rate of Bargarh district was 74.62% in 2011 which is greater than average literacy rate 72.87% of Odisha. Population-wise, out of total 983,783 literates, males were 557,217 while females were 426,566. Also the male literacy rate was 83.68% and the female literacy rate was 65.38% in Bargarh district.
| Bargarh district | Odisha | |
|---|---|---|
| Female | 65.38% | 64.01% |
| Male | 83.68% | 81.59% |
| Total | 74.62% | 72.87% |
Sex Ratio - Bargarh district
The Sex Ratio of Bargarh district is 977 . Thus for every 1000 men there were 977 females in Bargarh district. Also as per Census 2011, the Child Sex Ration was 957 which is less than Average Sex Ratio ( 977 ) of Bargarh district.
Population Density - Bargarh district
The total area of Bargarh district is 5,837 km2. Thus the density of Bargarh district is 254 people per square kilometer. As per the initial provisional data of Census 2011, around 78 sq. km. area is under urban region while 5,759 sq. km. is under rural region.
Urban/Rural Population - Bargarh district
As per the Census 2011 out of total population of Bargarh, 10.13% people lived in urban regions while 89.87% in rural areas. The total urban population was 150,110 out of which 76,558 were males while the remaining 73,552 were females. In rural areas of Bargarh, male population was 672,603 while the female population was 658,542.
The average sex ratio in urban regions of Bargarh was 961 females per 1000 males. Also the Child (0-6 age) sex ration of urban areas in Bargarh was 938 girls per 1000 boys. Thus the total children (0-6 age) living in urban areas of Bargarh were 16,589 which is 11.05% of total urban population. Similarly the average sex ratio in rural areas of Bargarh was 979 females per 1000 males. The Child sex ratio of rural areas in Bargarh was 959 girls per 1000 boys.
The average literacy rate in Bargarh for urban regions was 85.84 percent in which males were 91.51% literate while female literacy stood at 79.95%. The total literate population of Bargarh was 983,783. Similarly in rural areas of Bargarh, the average literacy rate was 73.36 percent. Out of which the literacy rate of males and females stood at 82.79% and 63.75% respectively. Total literates in rural areas of Bargarh were 869,172.
| Rural | Urban | |
|---|---|---|
| Population % | 89.87% | 10.13% |
| Total population | 1,331,145 | 150,110 |
| Male population | 672,603 | 76,558 |
| Female population | 658,542 | 73,552 |
| Sex ratio | 979 | 961 |
| Child sex ratio (0-6 age) | 959 | 938 |
| Child population | 146,333 | 16,589 |
| Literates | 869,172 | 114,611 |
| Average literacy | 73.36% | 85.84% |
| Male literacy | 82.79% | 91.51% |
| Female literacy | 63.75% | 79.95% |
Child Population - Bargarh district
According to Census 2011, there were 162,922 children between age 0 to 6 years in Bargarh district. Out of which 83,267 were male while 79,655 were female.
Working Population - Bargarh district
In Bargarh district out of total population, 762,092 were engaged in work activities. 62.2% of workers describe their work as Main Work (Employment or Earning more than 6 Months) while 37.8% were involved in Marginal activity providing livelihood for less than 6 months. Of 762,092 workers engaged in Main Work, 173,496 were cultivators (owner or co-owner) while 152,438 were Agricultural labourers.
| Total | Male | Female | |
|---|---|---|---|
| Main Workers | 474,390 | 372,806 | 101,584 |
| Cultivators | 173,496 | 153,167 | 20,329 |
| Agriculture Labourer | 152,438 | 103,347 | 49,091 |
| Household Industries | 34,886 | 23,513 | 11,373 |
| Other Workers | 113,570 | 92,779 | 20,791 |
| Marginal Workers | 287,702 | 100,499 | 187,203 |
| Non Working | 719,163 | 275,856 | 443,307 |
Nearby Districts from Bargarh
Below are the list of Districts near Bargarh district in Odisha.
| District | Population |
|---|---|
| Jharsuguda district population | 579,505 |
| Sambalpur district population | 1,041,099 |
| Debagarh district population | 312,520 |
| Sundargarh district population | 2,093,437 |
| Kendujhar district population | 1,801,733 |
| Mayurbhanj district population | 2,519,738 |
| Baleshwar district population | 2,320,529 |
| Bhadrak district population | 1,506,337 |
| Kendrapara district population | 1,440,361 |
| Jagatsinghapur district population | 1,136,971 |
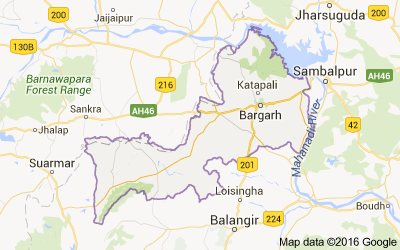
Bargarh district Map
Reference
- Census 2011 Data - censusindia.gov.in
- Bargarh, Odisha - Wikipedia