Khordha District Population, Caste, Religion Data (Odisha) - Census 2011
Khordha district of Odisha has a total population of 2,251,673 as per the Census 2011. Out of which 1,167,137 are males while 1,084,536 are females. In 2011 there were a total 494,212 families residing in Khordha district. The Average Sex Ratio of Khordha district is 929.
As per Census 2011 out of total population, 48.2% people live in Urban areas while 51.8% live in the Rural areas. The average literacy rate in urban areas is 91% while that in rural areas is 83%. Also the Sex Ratio of Urban areas in Khordha district is 898 while that of Rural areas is 959.
The population of Children of age 0-6 years in Khordha district is 237394 which is 11% of the total population. There are 123879 male children and 113515 female children between the age 0-6 years. Thus as per the Census 2011 the Child Sex Ratio of Khordha is 916 which is less than Average Sex Ratio (929) of Khordha district.
The total literacy rate of Khordha district is 86.88%. The male literacy rate is 82.04% and the female literacy rate is 73.07% in Khordha district.
To facilitate the administration, Khordha district is further divided into 21 Blocks (Taluka/Tehsil/Tahsil) which are administrative divisions denoting sub-districts. Blocks consists of multiple villages and a few towns.
Khordha Data as per Census 2011
As per the Population Census 2011 data, following are some quick facts about Khordha district.
| Total | Male | Female | |
|---|---|---|---|
| Children (Age 0-6) | 237,394 | 123,879 | 113,515 |
| Literacy | 86.88% | 82.04% | 73.07% |
| Scheduled Caste | 297,472 | 151,528 | 145,944 |
| Scheduled Tribe | 115,051 | 59,094 | 55,957 |
| Illiterate | 501,737 | 209,622 | 292,115 |
Caste-wise Population - Khordha district
Schedule Caste (SC) constitutes 13.2% while Schedule Tribe (ST) were 5.1% of total population in Khordha district of Odisha.
| Total | Male | Female | |
|---|---|---|---|
| Schedule Caste | 297,472 | 151,528 | 145,944 |
| Schedule Tribe | 115,051 | 59,094 | 55,957 |
Religion-wise Population - Khordha district
| Religion | Total | Male | Female | |
|---|---|---|---|---|
| Hindu | 2,147,632 | (95.38%) | 1,113,361 | 1,034,271 |
| Muslim | 84,060 | (3.73%) | 43,648 | 40,412 |
| Christian | 12,527 | (0.56%) | 6,246 | 6,281 |
| Sikh | 1,264 | (0.06%) | 655 | 609 |
| Buddhist | 475 | (0.02%) | 265 | 210 |
| Jain | 476 | (0.02%) | 235 | 241 |
| Other Religion | 434 | (0.02%) | 224 | 210 |
| No Religion Specified | 4,805 | (0.21%) | 2,503 | 2,302 |
Literacy Rate - Khordha district
The total literacy rate of Khordha district was 86.88% in 2011 which is greater than average literacy rate 72.87% of Odisha. Population-wise, out of total 1,749,936 literates, males were 957,515 while females were 792,421. Also the male literacy rate was 91.78% and the female literacy rate was 81.61% in Khordha district.
| Khordha district | Odisha | |
|---|---|---|
| Female | 81.61% | 64.01% |
| Male | 91.78% | 81.59% |
| Total | 86.88% | 72.87% |
Sex Ratio - Khordha district
The Sex Ratio of Khordha district is 929 . Thus for every 1000 men there were 929 females in Khordha district. Also as per Census 2011, the Child Sex Ration was 916 which is less than Average Sex Ratio ( 929 ) of Khordha district.
Population Density - Khordha district
The total area of Khordha district is 2,813 km2. Thus the density of Khordha district is 800 people per square kilometer. As per the initial provisional data of Census 2011, around 283 sq. km. area is under urban region while 2,530 sq. km. is under rural region.
Urban/Rural Population - Khordha district
As per the Census 2011 out of total population of Khordha, 48.16% people lived in urban regions while 51.84% in rural areas. The total urban population was 1,084,316 out of which 571,328 were males while the remaining 512,988 were females. In rural areas of Khordha, male population was 595,809 while the female population was 571,548.
The average sex ratio in urban regions of Khordha was 898 females per 1000 males. Also the Child (0-6 age) sex ration of urban areas in Khordha was 906 girls per 1000 boys. Thus the total children (0-6 age) living in urban areas of Khordha were 106,417 which is 9.81% of total urban population. Similarly the average sex ratio in rural areas of Khordha was 959 females per 1000 males. The Child sex ratio of rural areas in Khordha was 924 girls per 1000 boys.
The average literacy rate in Khordha for urban regions was 91.04 percent in which males were 94.24% literate while female literacy stood at 87.46%. The total literate population of Khordha was 1,749,936. Similarly in rural areas of Khordha, the average literacy rate was 82.95 percent. Out of which the literacy rate of males and females stood at 89.38% and 76.28% respectively. Total literates in rural areas of Khordha were 859,680.
| Rural | Urban | |
|---|---|---|
| Population % | 51.84% | 48.16% |
| Total population | 1,167,357 | 1,084,316 |
| Male population | 595,809 | 571,328 |
| Female population | 571,548 | 512,988 |
| Sex ratio | 959 | 898 |
| Child sex ratio (0-6 age) | 924 | 906 |
| Child population | 130,977 | 106,417 |
| Literates | 859,680 | 890,256 |
| Average literacy | 82.95% | 91.04% |
| Male literacy | 89.38% | 94.24% |
| Female literacy | 76.28% | 87.46% |
Child Population - Khordha district
According to Census 2011, there were 237,394 children between age 0 to 6 years in Khordha district. Out of which 123,879 were male while 113,515 were female.
Working Population - Khordha district
In Khordha district out of total population, 792,193 were engaged in work activities. 79.9% of workers describe their work as Main Work (Employment or Earning more than 6 Months) while 20.1% were involved in Marginal activity providing livelihood for less than 6 months. Of 792,193 workers engaged in Main Work, 79,793 were cultivators (owner or co-owner) while 64,072 were Agricultural labourers.
| Total | Male | Female | |
|---|---|---|---|
| Main Workers | 632,625 | 543,178 | 89,447 |
| Cultivators | 79,793 | 76,265 | 3,528 |
| Agriculture Labourer | 64,072 | 54,637 | 9,435 |
| Household Industries | 29,066 | 24,378 | 4,688 |
| Other Workers | 459,694 | 387,898 | 71,796 |
| Marginal Workers | 159,568 | 102,702 | 56,866 |
| Non Working | 1,459,480 | 521,257 | 938,223 |
Nearby Districts from Khordha
Below are the list of Districts near Khordha district in Odisha.
| District | Population |
|---|---|
| Puri district population | 1,698,730 |
| Nayagarh district population | 962,789 |
| Ganjam district population | 3,529,031 |
| Anugul district population | 1,273,821 |
| Dhenkanal district population | 1,192,811 |
| Gajapati district population | 577,817 |
| Jajapur district population | 1,827,192 |
| Kandhamal district population | 733,110 |
| Cuttack district population | 2,624,470 |
| Baudh district population | 441,162 |
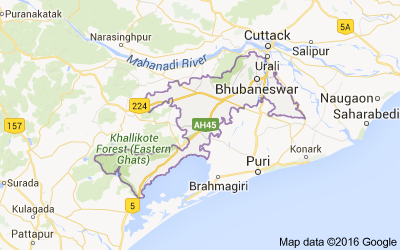
Khordha district Map
Reference
- Census 2011 Data - censusindia.gov.in
- Khordha, Odisha - Wikipedia