Etawah District Population, Caste, Religion Data (Uttar Pradesh) - Census 2011
Etawah district of Uttar Pradesh has a total population of 1,581,810 as per the Census 2011. Out of which 845,856 are males while 735,954 are females. In 2011 there were a total 277,527 families residing in Etawah district. The Average Sex Ratio of Etawah district is 870.
As per Census 2011 out of total population, 23.2% people live in Urban areas while 76.8% live in the Rural areas. The average literacy rate in urban areas is 82% while that in rural areas is 77.3%. Also the Sex Ratio of Urban areas in Etawah district is 897 while that of Rural areas is 862.
The population of Children of age 0-6 years in Etawah district is 227470 which is 14% of the total population. There are 121295 male children and 106175 female children between the age 0-6 years. Thus as per the Census 2011 the Child Sex Ratio of Etawah is 875 which is greater than Average Sex Ratio (870) of Etawah district.
The total literacy rate of Etawah district is 78.41%. The male literacy rate is 73.72% and the female literacy rate is 59.57% in Etawah district.
To facilitate the administration, Etawah district is further divided into 5 Tehsils (Taluka/Tehsil/Tahsil) which are administrative divisions denoting sub-districts. Tehsils consists of multiple villages and a few towns.
Etawah Data as per Census 2011
As per the Population Census 2011 data, following are some quick facts about Etawah district.
| Total | Male | Female | |
|---|---|---|---|
| Children (Age 0-6) | 227,470 | 121,295 | 106,175 |
| Literacy | 78.41% | 73.72% | 59.57% |
| Scheduled Caste | 388,283 | 208,731 | 179,552 |
| Scheduled Tribe | 169 | 89 | 80 |
| Illiterate | 519,807 | 222,273 | 297,534 |
Caste-wise Population - Etawah district
Schedule Caste (SC) constitutes 24.5% while Schedule Tribe (ST) were 0% of total population in Etawah district of Uttar Pradesh.
| Total | Male | Female | |
|---|---|---|---|
| Schedule Caste | 388,283 | 208,731 | 179,552 |
| Schedule Tribe | 169 | 89 | 80 |
Religion-wise Population - Etawah district
| Religion | Total | Male | Female | |
|---|---|---|---|---|
| Hindu | 1,457,892 | (92.17%) | 781,252 | 676,640 |
| Muslim | 113,961 | (7.2%) | 59,346 | 54,615 |
| Christian | 1,362 | (0.09%) | 717 | 645 |
| Sikh | 1,045 | (0.07%) | 567 | 478 |
| Buddhist | 1,733 | (0.11%) | 912 | 821 |
| Jain | 3,917 | (0.25%) | 2,058 | 1,859 |
| Other Religion | 94 | (0.01%) | 51 | 43 |
| No Religion Specified | 1,806 | (0.11%) | 953 | 853 |
Literacy Rate - Etawah district
The total literacy rate of Etawah district was 78.41% in 2011 which is greater than average literacy rate 67.68% of Uttar Pradesh. Population-wise, out of total 1,062,003 literates, males were 623,583 while females were 438,420. Also the male literacy rate was 86.06% and the female literacy rate was 69.61% in Etawah district.
| Etawah district | Uttar Pradesh | |
|---|---|---|
| Female | 69.61% | 57.18% |
| Male | 86.06% | 77.28% |
| Total | 78.41% | 67.68% |
Sex Ratio - Etawah district
The Sex Ratio of Etawah district is 870 . Thus for every 1000 men there were 870 females in Etawah district. Also as per Census 2011, the Child Sex Ration was 875 which is greater than Average Sex Ratio ( 870 ) of Etawah district.
Population Density - Etawah district
The total area of Etawah district is 2,311 km2. Thus the density of Etawah district is 684 people per square kilometer. As per the initial provisional data of Census 2011, around 51 sq. km. area is under urban region while 2,260 sq. km. is under rural region.
Urban/Rural Population - Etawah district
As per the Census 2011 out of total population of Etawah, 23.16% people lived in urban regions while 76.84% in rural areas. The total urban population was 366,299 out of which 193,116 were males while the remaining 173,183 were females. In rural areas of Etawah, male population was 652,740 while the female population was 562,771.
The average sex ratio in urban regions of Etawah was 897 females per 1000 males. Also the Child (0-6 age) sex ration of urban areas in Etawah was 874 girls per 1000 boys. Thus the total children (0-6 age) living in urban areas of Etawah were 44,556 which is 12.16% of total urban population. Similarly the average sex ratio in rural areas of Etawah was 862 females per 1000 males. The Child sex ratio of rural areas in Etawah was 876 girls per 1000 boys.
The average literacy rate in Etawah for urban regions was 81.99 percent in which males were 86.34% literate while female literacy stood at 77.16%. The total literate population of Etawah was 1,062,003. Similarly in rural areas of Etawah, the average literacy rate was 77.3 percent. Out of which the literacy rate of males and females stood at 85.98% and 67.21% respectively. Total literates in rural areas of Etawah were 798,203.
| Rural | Urban | |
|---|---|---|
| Population % | 76.84% | 23.16% |
| Total population | 1,215,511 | 366,299 |
| Male population | 652,740 | 193,116 |
| Female population | 562,771 | 173,183 |
| Sex ratio | 862 | 897 |
| Child sex ratio (0-6 age) | 876 | 874 |
| Child population | 182,914 | 44,556 |
| Literates | 798,203 | 263,800 |
| Average literacy | 77.3% | 81.99% |
| Male literacy | 85.98% | 86.34% |
| Female literacy | 67.21% | 77.16% |
Child Population - Etawah district
According to Census 2011, there were 227,470 children between age 0 to 6 years in Etawah district. Out of which 121,295 were male while 106,175 were female.
Working Population - Etawah district
In Etawah district out of total population, 506,072 were engaged in work activities. 71.4% of workers describe their work as Main Work (Employment or Earning more than 6 Months) while 28.6% were involved in Marginal activity providing livelihood for less than 6 months. Of 506,072 workers engaged in Main Work, 146,309 were cultivators (owner or co-owner) while 84,275 were Agricultural labourers.
| Total | Male | Female | |
|---|---|---|---|
| Main Workers | 361,588 | 321,871 | 39,717 |
| Cultivators | 146,309 | 136,787 | 9,522 |
| Agriculture Labourer | 84,275 | 75,426 | 8,849 |
| Household Industries | 13,494 | 9,737 | 3,757 |
| Other Workers | 117,510 | 99,921 | 17,589 |
| Marginal Workers | 144,484 | 91,842 | 52,642 |
| Non Working | 1,075,738 | 432,143 | 643,595 |
Nearby Districts from Etawah
Below are the list of Districts near Etawah district in Uttar Pradesh.
| District | Population |
|---|---|
| Kannauj district population | 1,656,616 |
| Auraiya district population | 1,379,545 |
| Farrukhabad district population | 1,885,204 |
| Kanpur Dehat district population | 1,796,184 |
| Kanpur Nagar district population | 4,581,268 |
| Rae Bareli district population | 3,405,559 |
| Lucknow district population | 4,589,838 |
| Jalaun district population | 1,689,974 |
| Unnao district population | 3,108,367 |
| Jhansi district population | 1,998,603 |
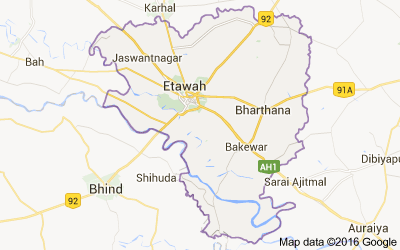
Etawah district Map
Reference
- Census 2011 Data - censusindia.gov.in
- Etawah, Uttar Pradesh - Wikipedia